|
Page
2 of 3
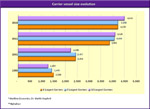
After
two decades the average vessel size for
these carriers had increased to between
2,200 TEU and 2,500 TEU - an increase of
roughly 1,000 TEU or more than 60 per cent.
 click image
to enlarge click image
to enlarge
In
the past 12 years the increase has been
even more dramatic. From 2001 to 2011 the
average size increased by more than 80 per
cent to over 4,000 TEU.
Today
the average vessel size for the 10 largest
carriers is 4,511 TEU, which is roughly
250 per cent more than what it was in 1980.
Given
the industry's orderbook today the average
vessel size is destined to continue climbing
in the coming years, particularly with Maersk's
Triple E class ships, which have a nominal
handling capacity of 18,000 TEU, entering
the market later this year.
The
increasing size of the average containership
has had multiple effects on the market today.
Firstly it has helped reduce unit costs
for those carriers that have the largest
vessels. Secondly, due to the perceived
cost benefits it has spurred more lines
to invest in larger vessels as well.
But
in spite of the perceived benefits the rush
to upsize has also contributed to the severe
supply overhang in the sector today.
It
has also contributed to what we will see
below as the subtle or silent consolidation
of the market.
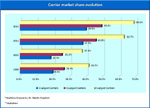
In
the chart below we can see the evolution
of the carriers' market share, in terms
of capacity deployed, from 1980 to 2013.
 click image
to enlarge click image
to enlarge
In
1980 the top 10 carriers in the sector held
a market share of 41.5 per cent. The top
three carriers alone held just a 20 per
cent market share in terms of active tonnage.
Essentially,
we can say that the container shipping industry
was rather fragmented at that time.
It
became even more fragmented by 2001 when
the ten largest carriers commanded 37.3
per cent of the market share, and the top
three held just 18.4 per cent.
Page 1 2 3
[Next]
|